In my last two posts, I have used the UCI mushroom dataset to illustrate two things. The first was the use of interestingness measures to characterize categorical variables, and the second was the use of binary confidence intervals to visualize the relationship between a categorical predictor variable and a binary response variable. This second approach can be applied to categorical predictors having any number of levels, but in the case of a binary (i.e., two-level) predictor, an attractive alternative is to measure their association with odds ratios. The objective of this post is to illustrate this idea and highlight a few important details.
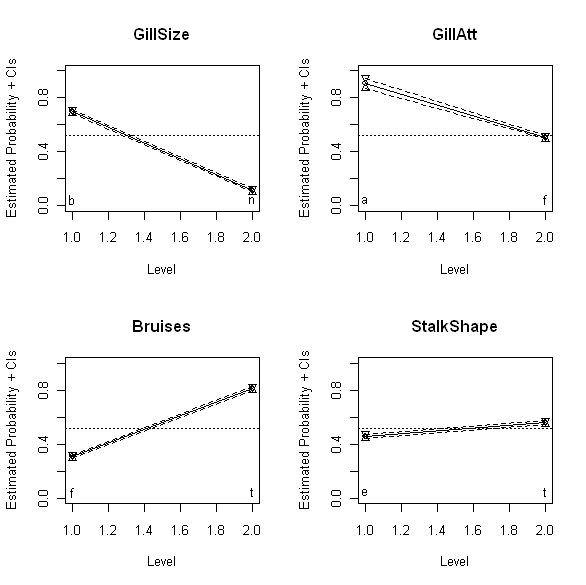
The above plots show the binomial confidence intervals discussed last time for four different binary mushroom characteristics: GillSize (upper left), GillAtt (upper right), Bruises (lower left), and StalkShape (lower right). Specifically, these plots show the estimated probability that mushrooms with each of the two possible values for these variables are edible. Thus, the upper left plot shows that mushrooms with GillSize characteristic “b” (“broad”) are much more likely to be edible than mushrooms with GillSize characteristic “n” (“narrow”). The other three plots have analogous interpretations: mushrooms with GillAtt value “a” (“attached”) are more likely to be edible than those with value “f” (“free”), mushrooms with bruises (Bruises value “t”) are more likely to be edible than those without (Bruises value “f”), and mushrooms with StalkShape value “t” (“tapering”) are slightly more likely to be edible than those with value “e” (“enlarging”). Also, while the smaller slopes for GillAtt and StalkShape suggest this association is weaker for these variables than for GillSize, where the slope appears much larger, it would be nice to have a quantitative measure of this degree of association that we could compare directly. This is particularly the case for GillSize and Bruises, where both associations appear to be reasonably strong, but since the reference lines run in opposite directions on the plots, it is difficult to reliably compare the slopes on the basis of appearance alone.
The odds ratio provides a simple quantitative association measure for these variables that allows us to make these comparisons directly. I discuss the odds ratio in Chapter 13 of Exploring Data in Engineering, the Sciences, and Medicine in connection with the practical implications of data type (e.g., numerical versus categorical data). The odds ratio may be viewed as an association measure between binary variables, and it is defined as follows. For simplicity, suppose x and y are two binary variables of interest and assume that they are coded so that they each take the values 0 or 1 – this assumption is easily relaxed, as discussed below, but it simplifies the basic description of the odds ratio. Next, define the following four numbers:
N00 = the number of data records with x = 0 and y = 0
N01 = the number of data records with x = 0 and y = 1
N10 = the number of data records with x = 1 and y = 0
N11 = the number of data records with x = 1 and y = 1
The odds ratio is defined in terms of these four numbers as
OR = N00 N11 / N01 N10
Since all of the four numbers appearing in this ratio are nonnegative, it follows that the odds ratio is also nonnegative and can assume any value between 0 and positive infinity. Further, if x and y are two statistically independent binary random variables, it can be shown that the odds ratio is equal to 1. Values greater than 1 imply that records with y = 1 are more likely to have x = 1 than x = 0, and similarly, that records with y = 0 are more likely to have x = 0 than x = 1; in other words, OR > 1 implies that the variables x and y are more likely to agree than they are to disagree. Conversely, odds ratio values less than 1 imply that the variables x and y are more likely to disagree: records with y = 1 are more likely to have x = 0 than x = 1, and those with y = 0 are more likely to have x = 1 than x = 0.
Often – as in the mushroom dataset – the binary variables are not coded as 0 or 1, but instead as two different categorical values. As a specific example, the binary response variable considered last time – the edibility variable EorP – assumes the values “e” (for “edible”) or “p” (for “poisonous” or “non-edible”). In the results presented here, we recode EorP to have the values 1 for edible mushrooms and 0 for non-edible mushrooms. For the mushroom characteristic GillSize shown in the upper left plot above, suppose we initially code the value “b” (“broad”) as 0 and the value “n” (“narrow”) as 1. This choice is arbitrary – we could equally well code “b” as 1 and “n” as zero – and its practical consequences are explored further below. For the coding just described, the odds ratio between mushroom edibility (EorP) and gill size (GillSize) is 0.056. Since this number is substantially smaller than 1, it suggests that edible mushrooms (y = 1) are unlikely to be associated with narrow gills (x = 1), a result that is consistent with the appearance of the upper left plot above.
An important practical issue in interpreting odds ratios is that of how much smaller or larger than 1 the computed odds ratio should be to be regarded as evidence for a “significant” association between the variables x and y. That is, since we are computing this ratio from uncertain data, we need a measure of precision for the odds ratio, like the binomial confidence intervals discussed in my last post: e.g., how much does the odds ratio change if some mushrooms previously declared edible is reclassified as poisonous, or if some additional mushrooms are added to our dataset? Fortunately, confidence intervals for the odds ratio are easily constructed. In his book Categorical Data Analysis (Wiley Series in Probability and Statistics) , Alan Agresti notes that confidence intervals for the odds ratio can be computed directly by appealing to the fact that the odds ratio estimator is asymptotically normal, approaching a Gaussian distribution in the limit of large sample sizes. He does not give explicit results for these direct confidence intervals, however, because he does not recommend them. Instead, Agresti advocates the construction of confidence intervals for the log of the odds ratio and transforming them back to get upper and lower confidence limits for the odds ratio itself. This recommendation rests primarily on three practical points: first, that the log of the odds ratio approaches normality faster than the odds ratio itself does, so this approach yields more accurate confidence intervals; second, this approach guarantees a positive lower confidence limit for the odds ratio, which is not the case for the direct approach; and, third, the same result can be used to compute confidence intervals for both the odds ratio and its reciprocal, a result that is again not true for the direct approach and that will be useful in the discussion presented below.
For the gill size example, Agresti’s recommended procedure yields a 95% confidence interval between 0.049 and 0.064. Since this interval does not include the value 1, we conclude that there is evidence to support an association between a mushroom’s gill size and its edibility, at least for mushrooms in the UCI dataset. Applying this procedure to the GillAtt characteristic shown in the upper right plot above yields an estimated odds ratio of 0.097 with a 95% confidence interval between 0.059 and 0.157. Again, the fact that this interval does not include 1 supports the idea that the GillAtt characteristic is associated with edibility (again, for the mushrooms considered here), but the fact that this odds ratio is larger (i.e., closer to the neutral value 1) also suggests that this association is weaker than that between edibility and the GillShape characteristic. Again, this result is in agreement with the visual appearance of the upper right plot above, relative to that of the upper left plot. The advantage of the odds ratio over these plots is that it provides a quantitative measure that can be used to make more objective comparisons, removing the subjective visual judgment required in comparing plots.
Applying this procedure to the Bruises variable yields an odds ratio of 9.972, with a 95% confidence interval from 8.963 to 11.093. The fact that these values are larger than 1 implies that mushrooms whose bruise characteristics have been coded as 1 (here, “t” for “true” or “bruised”) are more likely to be edible than those whose characteristics have been coded as 0 (here, “f” for “false” or “not bruised”). As noted above, this coding is arbitrary, as were the earlier assignments. An extremely useful observation is that if we reverse this assignment – i.e., for this example, if we code “bruised” as 0 and “not bruised” as 1 – we simply exchange the numbers N00 with N10 and also the numbers N11 with N01. The effect of these exchanges on the odds ratio is a reciprocal transformation:
OR = N00N11/N01N10 -> N10N01/N11N00 = 1/OR
This observation provides a simple basis for comparing results like those for GillSize where the odds ratio is less than 1 with those for Bruises where the odds ratio is greater than 1. As with the visual comparisons discussed above, it is not obvious from the odds ratios computed so far which of these variables is more strongly associated with mushroom edibility. Reversing the coding for GillSize so that “b” is coded as 1 and “n” is coded as 0 changes the odds ratio from 0.059 to 1/0.059 = 17.857. Since this number is larger than the odds ratio of 9.972 for Bruises, we can conclude that GillSize is more strongly associated with edibility – i.e., it is a better predictor of edibility for the mushrooms considered here – than Bruises, at least for this dataset.
In fact, the same trick can be applied to the confidence intervals, illustrating the third advantage noted above for Agresti’s preferred approach to constructing these intervals. Specifically, the asymptotically normal approximation says that the log of the odds ratio has a mean of log OR and a standard deviation S that can be simply computed from the four numbers N00, N01, N10, and N11. Since the Gaussian distribution is symmetric about its mean and log(1/OR) = - log(OR), it follows that the log of the reciprocal odds ratio has the same approximate standard deviation S as log(OR). In practical terms, this means that if we reverse the coding of our binary predictor variables, it is a simple matter to compute new confidence intervals as follows:
New lower CI = 1/Old upper CI
New odds ratio = 1/Old odds ratio
New upper CI = 1/Old lower CI
(Note here that because the reciprocal transformation is order-reversing, the transformation of the lower confidence limit yields the new upper confidence limit, and vice-versa; for a more detailed discussion of order-preserving and order-reversing transformations in general and the reciprocal transformation in particular, refer to Chapter 12 of Exploring Data.)
Applying these transformation results to the odds ratio for Bruises yields a new odds ratio of 0.100, with a 95% confidence interval from 0.090 to 0.112, which we can now compare with the earlier results for GillSize and GillAtt. Alternatively, if we reverse the coding of the results for GillSize and GillAtt, we obtain odds ratios that are larger than 1 between edibility and “the more edible value” of each of these mushroom characteristics. This has the advantage of giving us a sequences of odds ratios, all larger than 1, with the largest value suggestive of the strongest association between each mushroom characteristic variable and edibility. For the four mushroom characteristics shown in the above four plots, this approach yields the following odds ratios and their 95% confidence intervals:
GillSize: Lower CI = 15.625, OR = 17.857, Upper CI = 20.408
GillAtt: Lower CI = 6.369, OR = 10.309, Upper CI = 16.949
Bruises: Lower CI = 8.963, OR = 9.972, Upper CI = 11.093
StalkShape: Lower CI = 1.384, OR = 1.512, Upper Ci = 1.651
These results suggest that, of these four variables, the best predictor of mushroom edibility is GillSize, followed by GillAtt as second-best, then Bruises, and finally StalkShape as least predictive. These conclusions are probably the same as we would draw based on a careful comparison of the plots shown above, but the odds ratios computed in the way just described lead us to these conclusions much more directly.
Finally, it is important to make three points. First, as I have noted before – but the point is important enough to bear repeating – the associations described here between these binary mushroom characteristics and edibility are based entirely on the UCI mushroom dataset. Thus, these conclusions are only as representative of mushrooms in general or in any particular setting as the UCI mushroom dataset is representative of this larger and/or different mushroom population. In particular, mushrooms from other locales or unusual environments may exhibit different relationships between edibility and gill size or other characteristics than the UCI mushrooms do. The second key point is that the results presented here only attempt to assess the predictability of a single binary mushroom characteristic in isolation. To get a more complete picture of the relationship between mushroom characteristics and edibility, it is necessary to explore more general multivariate analysis techniques like logistic regression. More about that later. Last but not least, the third point is that I realized in reviewing this post before I issued it that I hadn't included any actual R code to compute odds ratios. In my next post, I will remedy this problem, giving a detailed view of how the numbers presented here were obained.
Measuring association using w88 lua dao
ReplyDeleteodds ratios ca cuoc lien minh w88
The second key point is that the results presented here only attempt to assess đăng ký daga68 the predictability of a single binary mushroom characteristic in isolationda ga truc tuyen
ReplyDelete